Univariate Linear Regression
Sacpy.LinReg
Fit the below equation:
\[y = a x+b\]
parameter:
x: x.shape = (time,)
y: y.shape = (time,n1,n2,…)
attribute:
slope: a, shape = (n1,n2,…)
intcpt: b, shape = (n1,n2,…)
corr: correlation, shape = (n1,n2,…)
p_value: t-test p_value shape = (n1,n2,…)
method:
mask (threshold=0.05): mask unsiginifcant values (p_value>threshold). Get self.slope1, self.intcpt1, self.corr1
Example
Load Module
[1]:
%load_ext autoreload
%autoreload 2

import xarray as xr
import numpy as np
import sacpy as scp
Get SST Data and calculate SST anomaly
Get Nino3.4 Index
[2]:
# load sst data
sst = scp.load_sst()['sst']
# get sst anomaly (ssta)
ssta = scp.get_anom(sst,method=0)
Nino34 = ssta.loc[:,-5:5,190:240].mean(("lon","lat"))
Linear Regression
[3]:
LinReg = scp.LinReg(Nino34,ssta)
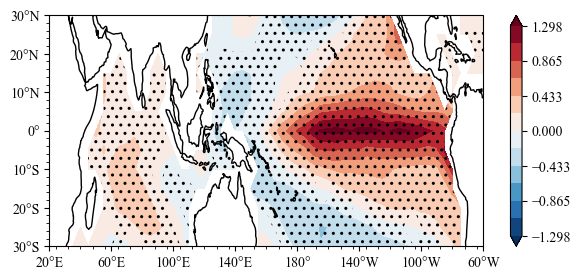
Plot
plot the slope and significance test
[5]:
import sacpy.Map
import matplotlib.pyplot as plt

plt.figure(figsize=[7,3])
m,ax = LinReg.slope.splot()
# significance test(p>0.95)
ax.sig_plot(ssta.lon,ssta.lat,LinReg.p_value,thrshd=0.05)
[5]:
<cartopy.mpl.contour.GeoContourSet at 0x159a33ac0>