Plot Function
get_levels
get levels of data
Parameter
data (np.ndarray): data need to get levels
percentile (int,default=98%): max value or min value percentile
num_level (int, default=13): colorbar levels
zero_sym (bool, default=True): levels is zero symmetric or not
Returns:
np.ndarray: levels for contourf or contourf
Example
[2]:
import sacpy as scp
import sacpy.Map

sacpy.Map.get_levels(scp.load_sst()['sst'][0])
[2]:
array([-2.97376192e+01, -2.47813493e+01, -1.98250795e+01, -1.48688096e+01,
       -9.91253974e+00, -4.95626987e+00,  3.55271368e-15,  4.95626987e+00,
        9.91253974e+00,  1.48688096e+01,  1.98250795e+01,  2.47813493e+01,
        2.97376192e+01])
GeoAxesSubplot.scontourf
contourf function for Cartopy.GeoAxesSubplot
parameter
the same parameter for plt.contourf
automatically choose the levels (use
get_levels)no need for “transform”
default cmap is “RdBu_r”
Returns:
mpl.contour.QuadContourSet
GeoAxesSubplot.scontour
contour function for Cartopy.GeoAxesSubplot
parameter
the same parameter for plt.contour
automatically choose the levels (use
get_levels)no need for “transform”
Returns:
mpl.contour.QuadContourSet
GeoAxesSubplot.sig_plot
Significance test dot
Parameter:
x (np.ndarray or xr.Dataarray): x
y (np.ndarray or xr.Dataarray): y
pvalue (np.ndarray): p value
thrshd (float, optional): threshold of pvalue. Defaults to 0.05.
marker (str, optional): mark of Significance test dot. Defaults to “..”.
Returns:
mpl.contour.QuadContourSet
GeoAxesSubplot.spcolormesh
pcolormesh function for Cartopy.GeoAxesSubplot
parameter
the same parameter for plt.pcolormesh
automatically choose the levels (use
get_levels)no need for “transform”
default cmap is “RdBu_r”
GeoAxesSubplot.squive
pcolormesh function for Cartopy.GeoAxesSubplot
parameter
the same parameter for plt.pcolormesh
stepx: Number of intervals in x direction
stepy: Number of intervals in y direction
no need for “transform”
GeoAxesSubplot.draw_ticks
draw map ticks
Parameter:
extend (list): extend of map [x1, x2, y1, y2]
stepx (int, optional): big x step. Defaults to 30.
stepy (int, optional): big y step. Defaults to 10.
smallx (int, optional): x small step. Defaults to 5.
smally (int, optional): y small step. Defaults to 5.
bigx/bigy (int, optional): Resolution in X and Y directions
GeoAxesSubplot.init_map
plot the coastlines of the map and draw longitude and latitude ticks
Parameter
same_size: if True, use ax.set_aspect(“auto)
*kwargs for draw_ticks
xr.Dataarray.splot
2-D plot.contourf for xr.Dataarray
Parameter
ax
label
kw1: for scontourf
kw2: for init_map()
Return
mpl.contour.QuadContourSet
ax
Plot Example
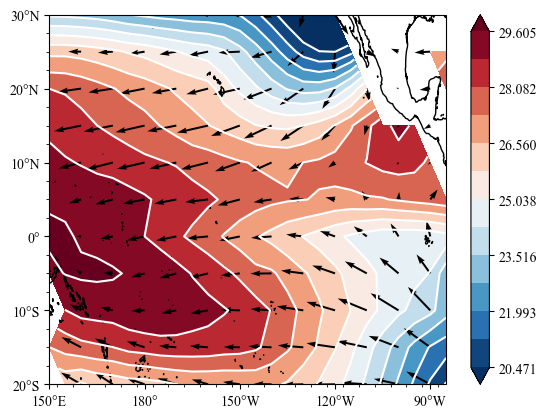
[15]:
import sacpy.Map
import sacpy as scp

sst = scp.load_sst()['sst'].mean("time").loc[-20:30,150:275]
m,ax = sst.splot()
ax.scontour(m,colors="white")
u,v = scp.load_10mwind()['u'].mean("time"),scp.load_10mwind()['v'].mean("time")
ax.squiver(u.lon,v.lat,u,v,stepx=2,stepy=1)
[15]:
<matplotlib.quiver.Quiver at 0x16b3484c0>